The Market Gary Actually Described
Every August Gary Keller takes about forty minutes to pull the economy apart in front of a room full of agents. This year the headline numbers all looked fine and the room did not feel fine, and the gap between those two things is the whole story. Here is what he actually said, chart by chart.
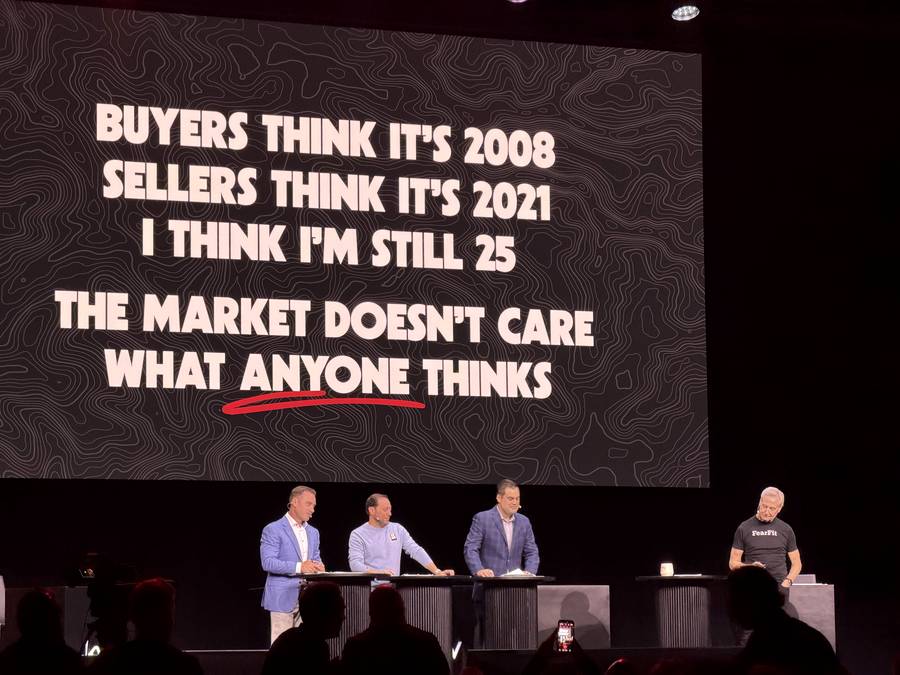
Buyers think it’s 2008.
Sellers think it’s 2021.
I think I’m still 25.
The market doesn’t care what anyone thinks.

If you have been telling clients the market is about to break loose, this is the session that explains why it hasn’t. And if you have been telling them it’s 2008 again, it explains why that’s wrong too. Most of what follows is not bad news exactly. It’s stranger than that.
Unemployment looks great, GDP looks fine, and none of it feels good. The labor market is frozen rather than healthy, inflation has turned back up, mortgage rates never came down, and home sales are grinding through what may be the longest stagnation in modern history. The whole economy is being carried by AI capital spending. And there is now more industry volume sitting in fewer hands than almost ever.
The framework Gary runs every year
Three questions in the middle of the circle. Do people have jobs? (unemployment). Are they spending money? (GDP). What are they paying for it? (inflation). Two forces press in from outside: cost of money and government policy uncertainty.
That left side right now is what’s giving you fits. It’s the uncertainty of the current federal government.
Gary Keller
The good number that isn’t
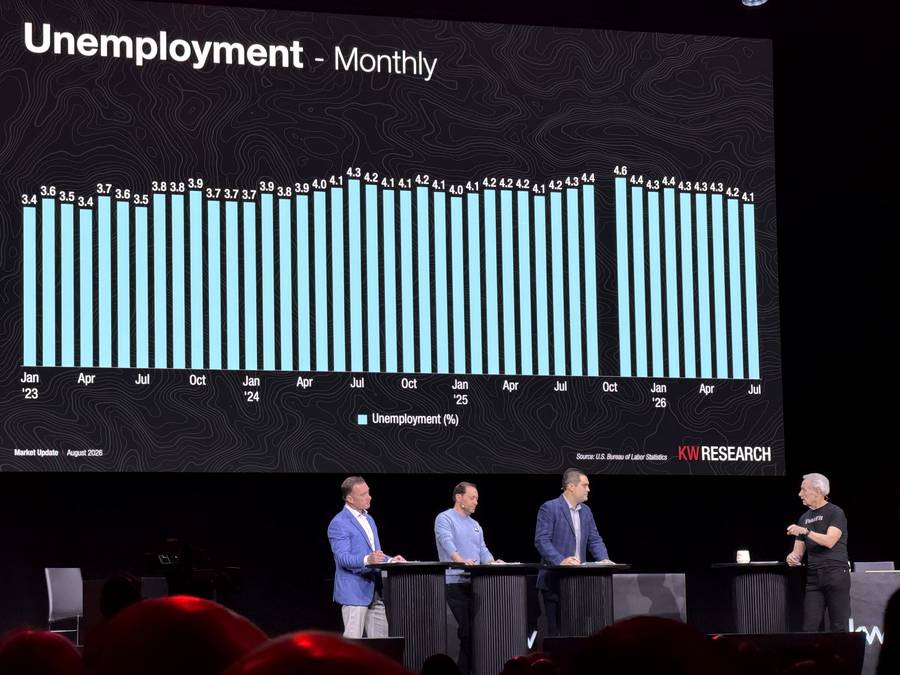
Unemployment climbed steadily from 3.4% in Jan ’23 to a peak of 4.6% in October 2025, then fell back to 4.1% by July 2026. It got better through 2026 while job creation ran near zero. That combination only happens when people are leaving the labor force.
The rate is low because the denominator is shrinking, not because hiring is strong. Labor force growth has stalled on immigration restrictions, retirements, and people voluntarily stepping out. Gary’s term for the environment: low hire, low fire. Ruben’s word: stagnant.
We’re not getting enough new job seekers going in to drive that up. It’s not a fact that we’re getting more and more jobs, we’re just having less and less people looking for them.
Ruben Gonzalez
The participation stat Jason Abrams dropped
- Workforce participation for men sits at 66.8%, able bodied and ready to work
- That is the lowest since 1948
- Job growth is concentrated in healthcare, nursing and human services, fields staffed predominantly by women
You have one group that says [AI] is going to create more jobs than ever, just like the internet did. And then you have other people that say it’s going to eliminate a bunch of them. We just don’t know.
Jason Abrams
Annual context: 2019 3.7% · 2020 8.1% · 2021 5.3% · 2022 3.6% · 2023 3.6% · 2024 4.0% · 2025 4.5% · 2026 proj. 4.4%
Job growth is anemic, and briefly negative
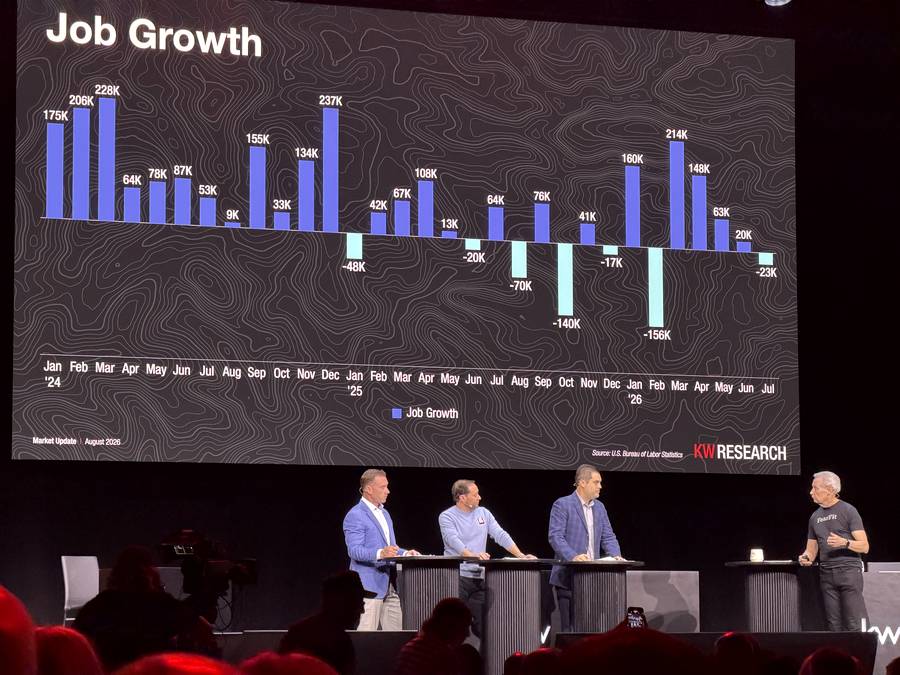
2025 had five negative months: Jan −48K, Jun −20K, Aug −70K, Oct −140K, Dec −17K. 2026 has had two so far: Feb −156K, the deepest month in the series, and Jul −23K.
The 2026 run reads 160K, −156K, 214K, 148K, 63K, 20K, −23K. That averages roughly 61K a month, exactly the number Gary cited. The strongest stretch in the whole series was early 2024 (175K, 206K, 228K) plus Dec 2024 at 237K.
Where the losses sit: federal government jobs and the financial sector. Cody Gibson called the contraction astonishing. The warning sign: healthcare, which has carried nearly all the growth, has now slowed its own hiring.
We should not be at 4.1 with that kind of anemic job growth.
Gary Keller
Job openings and unemployed people just crossed
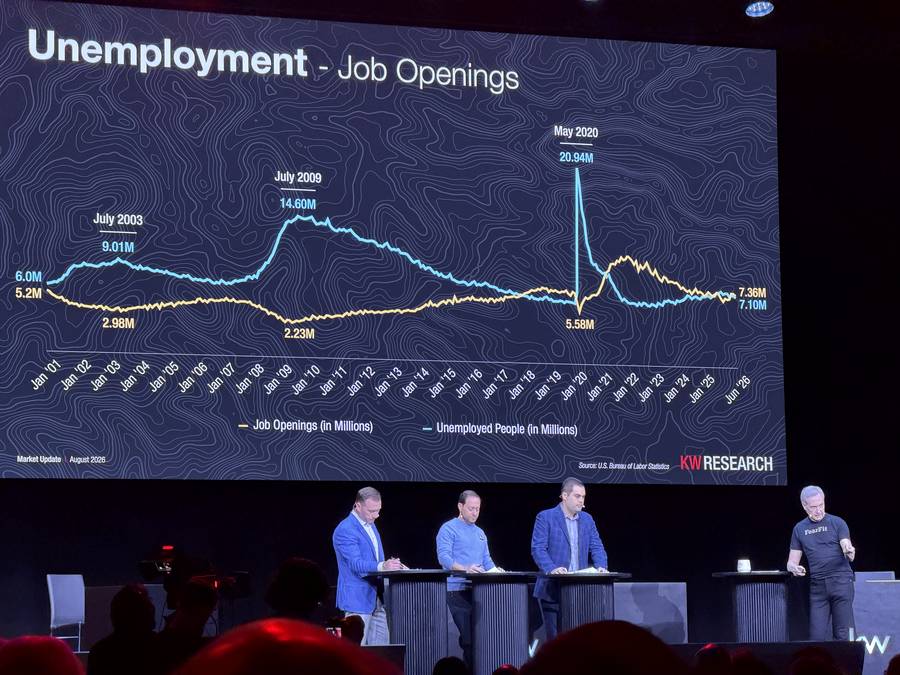
| Date | Unemployed | Job openings |
|---|---|---|
| July 2003 | 9.01M | 2.98M |
| July 2009 | 14.60M | 2.23M |
| May 2020 | 20.94M | 5.58M |
| June 2026 | 7.10M | 7.36M |
In 2022 and 2023 there were far more jobs than applicants, so anyone job hunting had leverage. That is what drove the strong wage growth of that period. The leverage is gone.
You have the job but you couldn’t necessarily change your job. It’s harder to go negotiate for more money. That’s kind of where we are right now.
Ruben Gonzalez
Right now, wages are basically keeping up with inflation and not much more than that.
Ruben Gonzalez
Spending is slowing and the sugar high is spent
Historical shape: 2020 −2.2%, 2021 +5.8%, 2022 1.9%, 2024 2.8%, 2025 2.1%, 2026 proj. 2.0%. The only other negative years on the chart are 2009 at −2.6% and 1991 at −0.1%.
Q2 2026 consumer spending came in at a healthy 3.2%. But that was juiced by disproportionately large tax refunds flowing from last year’s tax bill, roughly $150 billion into the economy. One year boost, and it’s now spent.
Inflation turned back the wrong way
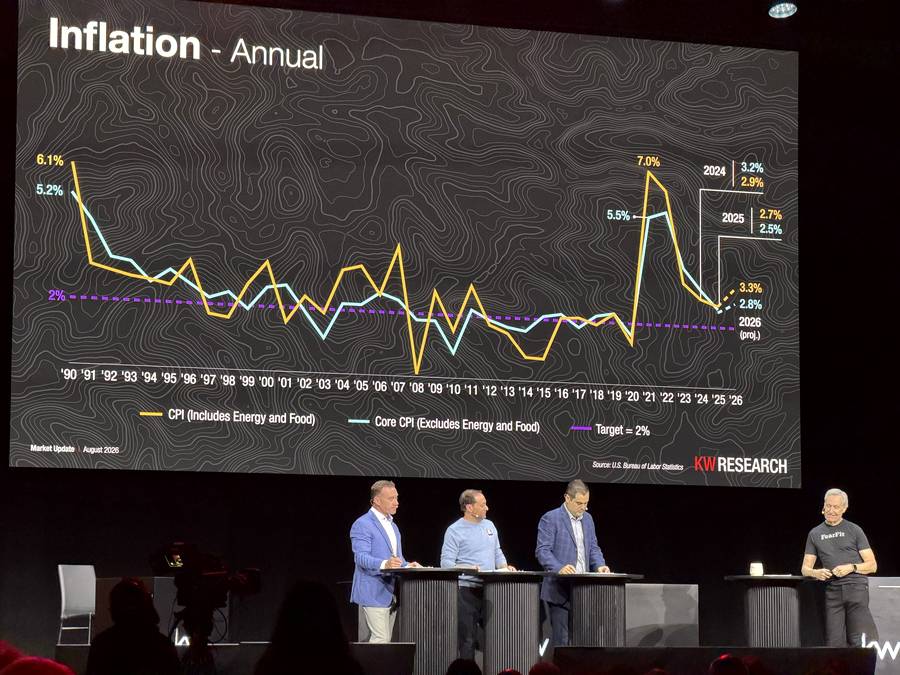
| Year | CPI (incl. energy & food) | Core CPI |
|---|---|---|
| 2024 | 3.2% | 2.9% |
| 2025 | 2.7% | 2.5% |
| 2026 (proj.) | 3.3% | 2.8% |
| Fed target | 2.0% | |
2025 was moving toward target. 2026 turned back up and away from it. Three Fed members voted to raise rates at the last meeting, and the next one is genuinely uncertain, which Ruben called new territory. We have likely entered a tightening phase rather than a loosening one.
That line’s going in the wrong direction now. We needed it to come down to two percent.
Ruben Gonzalez
Where the inflation actually is
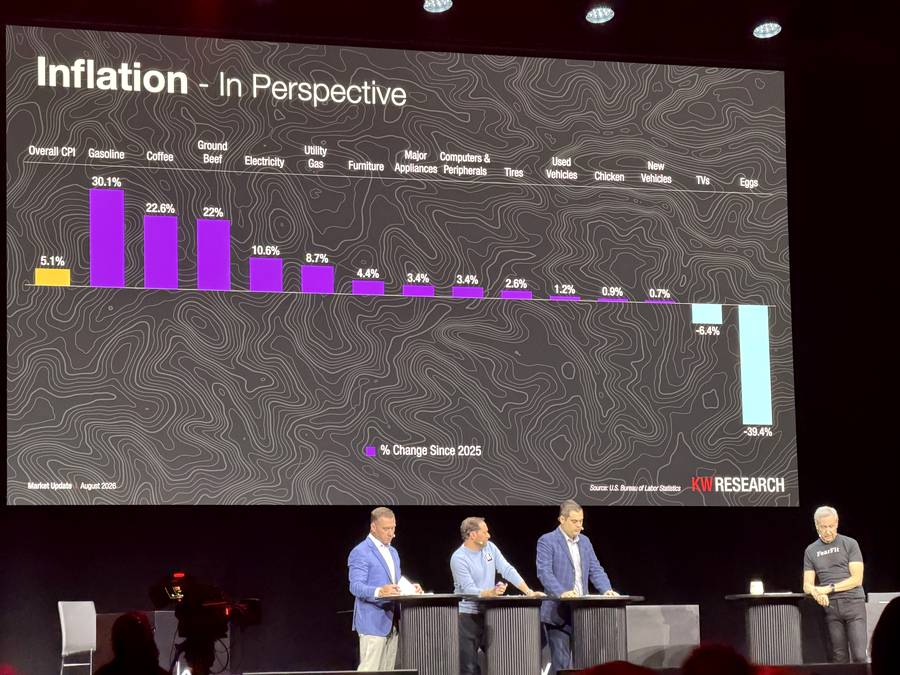
| Item | Change since 2025 |
|---|---|
| Gasoline | +30.1% |
| Coffee | +22.6% |
| Ground beef | +22.0% |
| Electricity | +10.6% |
| Utility gas | +8.7% |
| Furniture | +4.4% |
| Major appliances | +3.4% |
| Computers & peripherals | +3.4% |
| Tires | +2.6% |
| Used vehicles | +1.2% |
| Chicken | +0.9% |
| New vehicles | +0.7% |
| TVs | −6.4% |
| Eggs | −39.4% |
| Overall CPI | +5.1% |
Gasoline is the tail that wags the dog. When gas rises, delivery costs push up everything else on the list. Eggs are not a win, they’re a correction back into alignment after being wildly overpriced.
$5,000 a year makes a big difference to someone who’s making forty, fifty, sixty. Not as big a deal for someone who’s making one hundred, one fifty, two hundred. You have two different experiences going on in America right now.
Gary Keller
The setup that didn’t happen
This is the most important narrative beat of the session. Going into 2025 the economy was set up beautifully for rates to fall on their own. The playbook was simple: do nothing unusual and the cost of money comes down. Historically, low sales periods run about four years before the turn. Real estate would then have carried the economy, because sales beget paint, carpet, landscaping and appliances.
Never underestimate the willingness to ignore when things are good to make them bad.
Gary Keller, on new administrations. He flagged it as non political: “that happens on both sides of the aisle”
Ruben’s marker: “When we came in here in February, rates were below six percent.” Instead of the 3.8% or 2.7% environment some people were hoping for, the industry is sitting near 6.5%.
Possibly the longest stagnation in modern history
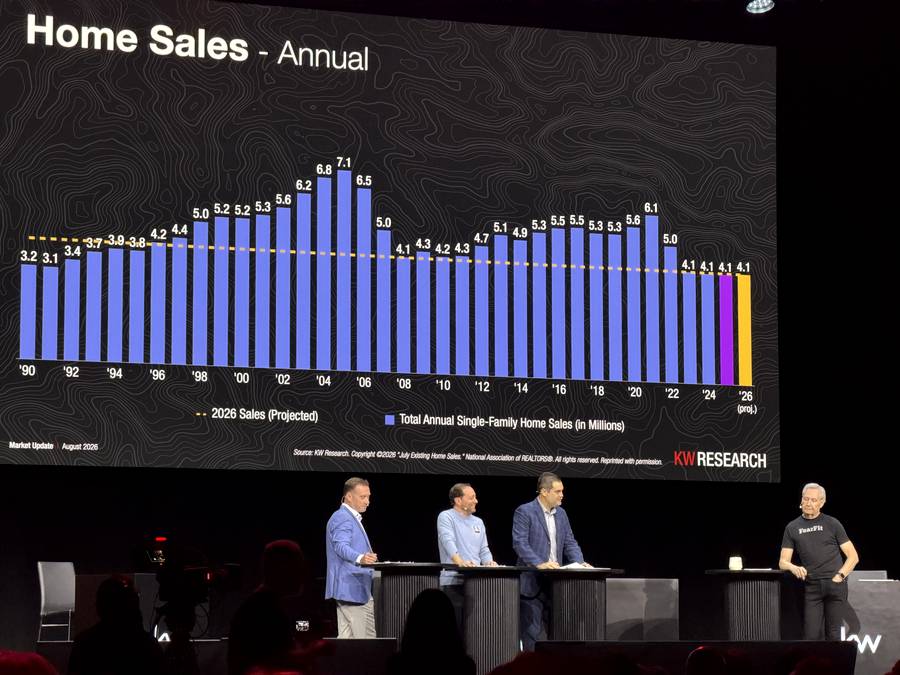
| Year | Total existing single family sales |
|---|---|
| 2005 (peak) | 7.08M |
| 2008 | 4.11M |
| 2021 | 6.02M |
| 2023 | 4.1M |
| 2024 | 4.1M |
| 2025 | 4.06M |
| 2026 (proj.) | 4.10M |
Four consecutive years pinned at roughly 4.1M. Long view anchors: 1970 at 1.61M, 1978 at 3.99M, 1982 at 1.99M, 2005 at 7.08M, 2021 at 6.02M.
This could be the longest period of stagnation in modern history.
Gary Keller · “Going back to at least the seventies” (Ruben Gonzalez)
Monthly, seasonally adjusted annualized rate (millions)
| Month | 2025 | 2026 |
|---|---|---|
| Jan | 4.09 | 4.02 |
| Feb | 4.15 | 4.13 |
| Mar | 4.02 | 4.01 |
| Apr | 4.00 | 4.04 |
| May | 4.04 | 4.19 |
| Jun | 3.93 | 4.13 |
| Jul | 4.01 | 4.06 |
| Aug | 4.00 | no data |
| Sep | 4.05 | no data |
| Oct | 4.11 | no data |
| Nov | 4.09 | no data |
| Dec | 4.27 | no data |
Both years sit in a remarkably narrow band, roughly 3.9M to 4.3M. 2026 has run ahead of 2025 every month from April through July, which is the ground Cody Gibson referred to making up after a slow January and February.
Summer sales bumps tracked directly to rate dips caused by the ceasefire. As that unwinds, sales are trending down again. Expect rate volatility all year and expect to see it in the sales numbers. Ruben, that morning: “Bond prices are up this morning because oil prices are up.”
Prices are converging back on the 4% trend
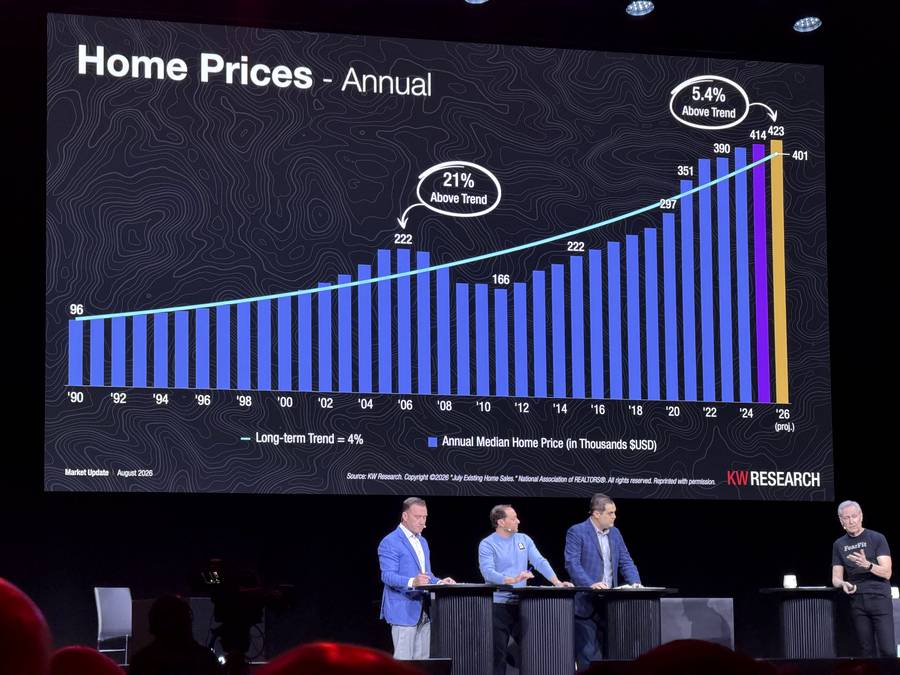
The long term trend is 4% a year. By next year prices land essentially on that line, which means buyers are paying almost exactly what they should be paying. And it still won’t feel that way.
This is a slide that you would xerox and hand to anybody thinking of buying or selling. You could simply say: “You can bet on the four percent. You can bet it’s going to happen.”
Gary Keller
The wealth tangent
This ran long and was arguably the most quotable stretch of the session.
If you go back to ’06 and ask, “Who in here would buy every piece of property in your hometown if you could go back twenty years?” Everyone was like, “Me!” But that was the peak of the implosion of the bubble. So here is the reality: today, although it doesn’t feel cheap, you should go buy every piece of real estate in your hometown, because twenty years from now you are going to wish that you had.
Jason Abrams
You are not buying at the top of the market. You are buying at the top of the moment.
Cody Gibson
If you buy two or three properties every year, you’ll have so much money that your helicopter might not get close enough to shore to get cell service.
Jason Abrams
People do not understand the concept of compounding. They don’t, because people don’t study money. When the richest investor in the world tells you that the most astounding thing on the planet is the concept of compounding, pay attention.
Gary Keller
People always argue “if I paid rent I’d be paying a little cheaper and I’d have that money.” But you wouldn’t invest that money. That’s the problem. Paying off a mortgage is forced savings.
Gary Keller
Cody on the generational shift: first time buyer age keeps climbing, and the van by the river lifestyle now costs $200,000 for the van. Ruben’s supporting fact: Wall Street isn’t just buying, it’s building, despite where the market is.
Price cuts, and 51% more sellers than buyers
Both lines have climbed steadily since 2021. Gary’s read on luxury: a much larger share of that segment is discretionary. They’ll have to sell, they can’t sell, maybe sell.
You are going to continue to see price improvements happening, and you need to have a pricing strategy when you go in.
Jason Abrams
The price governor is broken
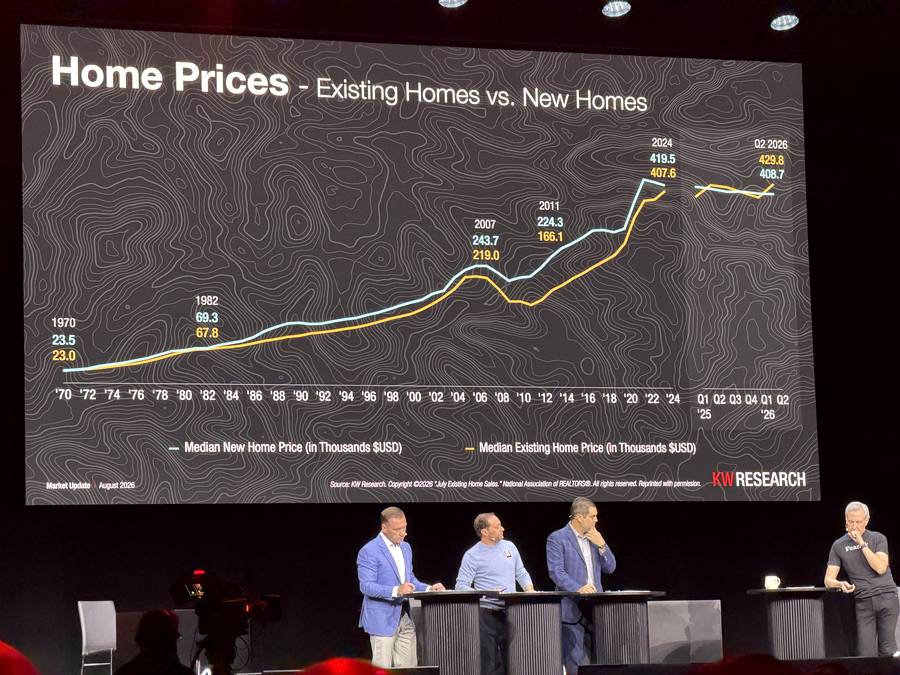
| Period | Median NEW home | Median EXISTING home |
|---|---|---|
| 1970 | $23.5K | $23.0K |
| 1982 | $69.3K | $67.8K |
| 2007 | $243.7K | $219.0K |
| 2011 | $224.3K | $166.1K |
| 2024 | $419.5K | $407.6K |
| Q2 2026 | $408.7K | $429.8K |
New homes are now cheaper than existing homes. New construction pricing has always acted as a governor on existing home prices, because it reflects what materials actually cost today. With that governor inverted, existing home appreciation should slow.
It’s a result of these thin markets. When you get people locked into low mortgage rates, you get fewer sellers, which keeps existing prices elevated. Builders don’t have that option. If you’ve got a development with 500 homes you’ve been working on for two years, you have to sell those houses.
Ruben Gonzalez
Inventory is loosening, unevenly
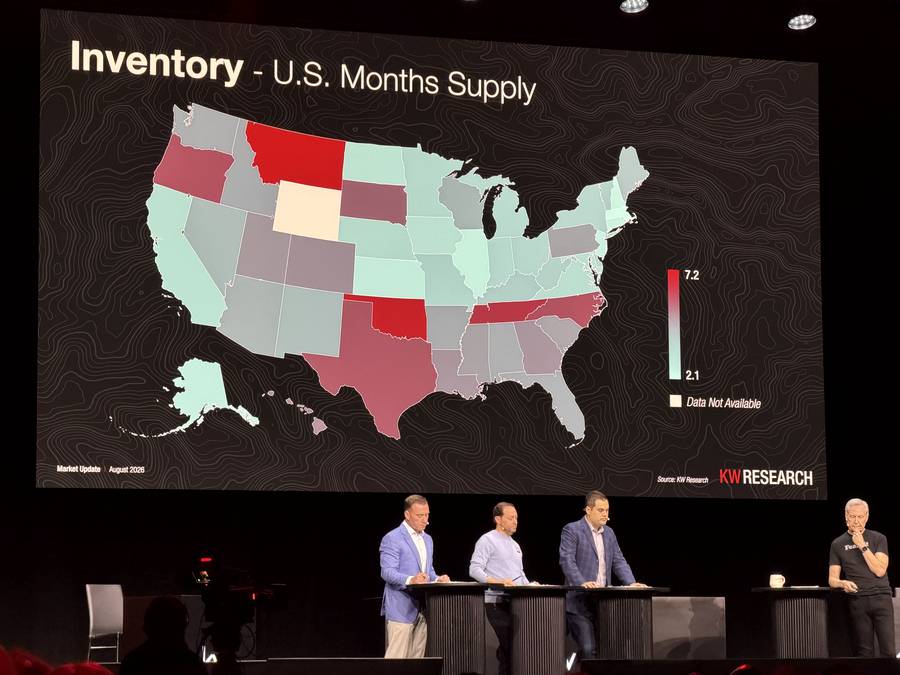
Months supply of inventory
| Month | 2025 | 2026 |
|---|---|---|
| Jan | 3.5 | 3.8 |
| Feb | 3.5 | 3.8 |
| Mar | 4.0 | 4.2 |
| Apr | 4.4 | 4.4 |
| May | 4.6 | 4.5 |
| Jun | 4.7 | 4.6 |
| Jul | 4.6 | 4.6 |
| Aug | 4.6 | no data |
| Sep | 4.6 | no data |
| Oct | 4.4 | no data |
| Nov | 4.2 | no data |
| Dec | 3.5 | no data |
2026 opened noticeably looser than 2025, 3.8 against 3.5 months in January and February, and the two years have converged since spring at roughly 4.5 to 4.6 months.
| Softer, more inventory | Tighter, still seller favorable |
|---|---|
| Texas | Midwest |
| Oklahoma | Northeast |
| The Carolinas | New England |
| Gulf Coast | |
| The West, relatively |
Generally across the board the trend is more inventory coming on market.
Ruben Gonzalez
The hole that never got filled
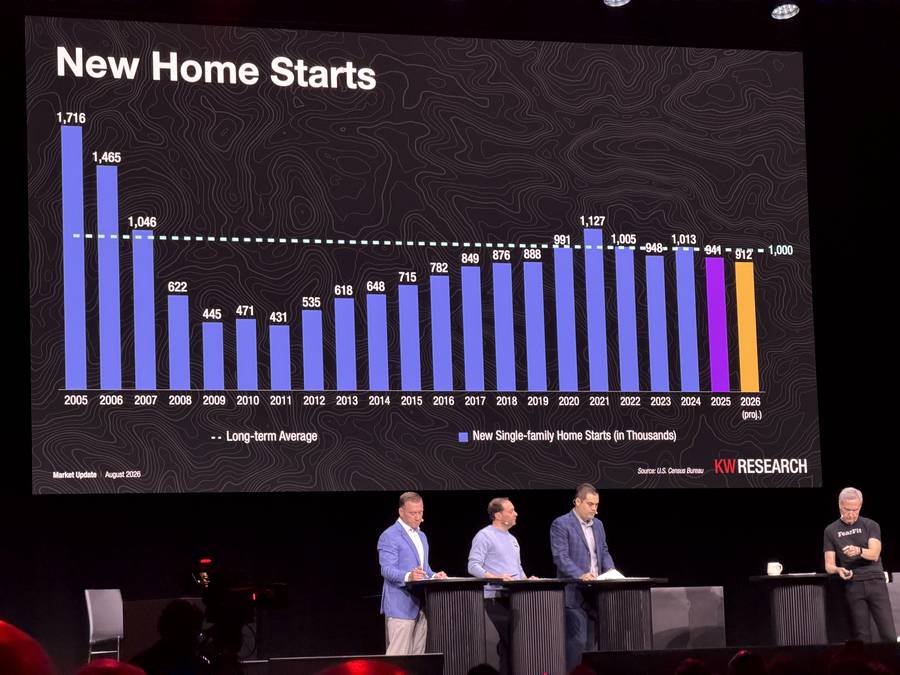
| Year | New single family starts |
|---|---|
| 2005 (peak) | 1,716K |
| 2009 | 445K |
| 2011 (trough) | 431K |
| 2021 | 1,127K |
| 2024 | 1,013K |
| 2025 | 941K |
| 2026 (proj.) | 912K, lowest since 2019 |
| Long term average | 1,000K |
Gary’s structural point: the industry needs roughly four years at 1.7 million starts to make up for the housing that was never built after the Great Recession. That missing supply is what drove existing home prices up, because there simply wasn’t competition.
Existing home sales dipped much like 2009, but new home building didn’t. Builders are sitting on nine months of new construction inventory against a normal six. That is exactly why new home prices have fallen below existing.
On why the last recovery took a decade, Gary pointed at the banks. “They took such a bath that it took almost a decade for banks to come back into the lending business for real estate.”
Where mortgage rates sit against history
Treasury yields are the actual driver
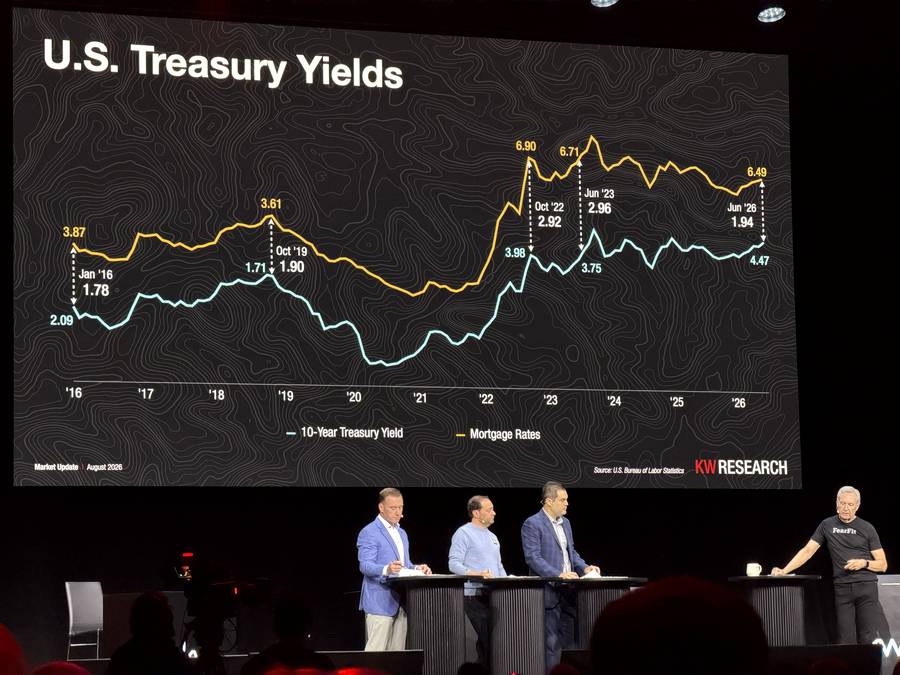
| Date | 10 yr Treasury | Mortgage rate | Spread |
|---|---|---|---|
| Jan 2016 | 1.78% | 3.87% | 2.09 |
| Oct 2019 | 1.71% | 3.61% | 1.90 |
| Oct 2022 | 3.98% | 6.90% | 2.92 |
| Jun 2023 | 3.75% | 6.71% | 2.96 |
| Jun 2026 | 4.47% | 6.49% | 1.94 |
The warning: the 10 year has moved up to about 4.7%, which means mortgage rates are headed up. And in rising environments the spread tends to widen. It hit nearly 3 points in 2023. If perceptions around housing sour, mortgage rates can climb faster than treasuries do.
Most people think the Fed rate determines mortgage rates, but that’s not really accurate. It influences it, but it’s actually the ten year bond yield.
Gary Keller
Affordability
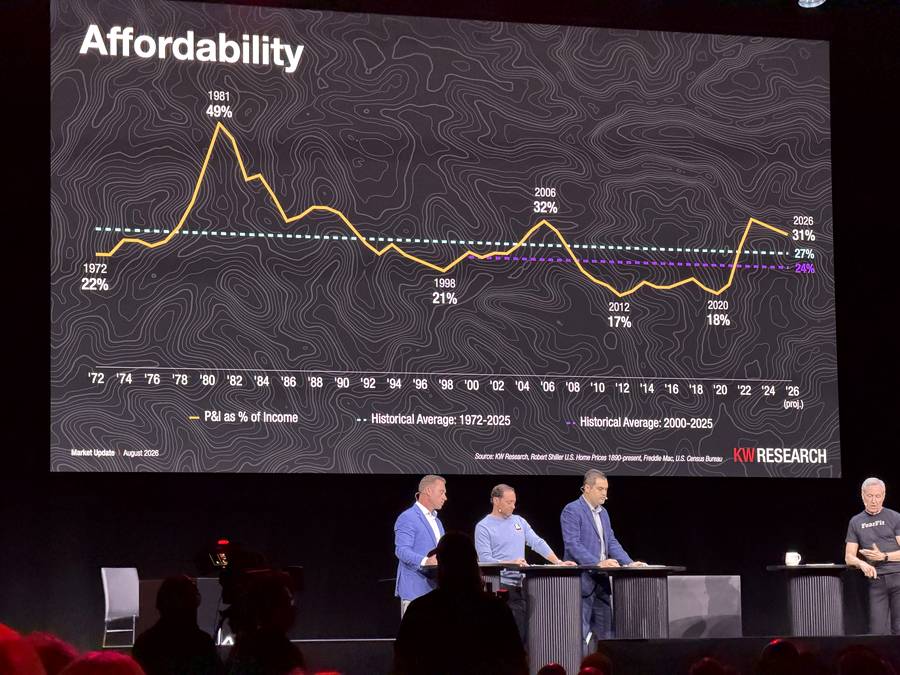
| Year | P&I as % of income |
|---|---|
| 1972 | 22% |
| 1981, worst ever | 49% |
| 1998 | 21% |
| 2006 | 32% |
| 2012 | 17% |
| 2020 | 18% |
| 2026 | 31% |
| Historical avg 1972 to 2025 | 27% |
| Historical avg 2000 to 2025 | 24% |
Today’s 31% is worse than both averages, and nowhere near 1981. The 17% to 19% run of the 2010s and 2020 was, in Gary’s words, the glory days of affordability, and it distorted everyone’s baseline.
Prices plus mortgage together sit only about 4% above where they should be. On a $500,000 home that is roughly $20,000. Not the catastrophe it feels like.
You have to watch emotion versus logic. Most decisions are made on emotion. That’s the challenge.
Gary Keller
Sides per agent, the squeeze
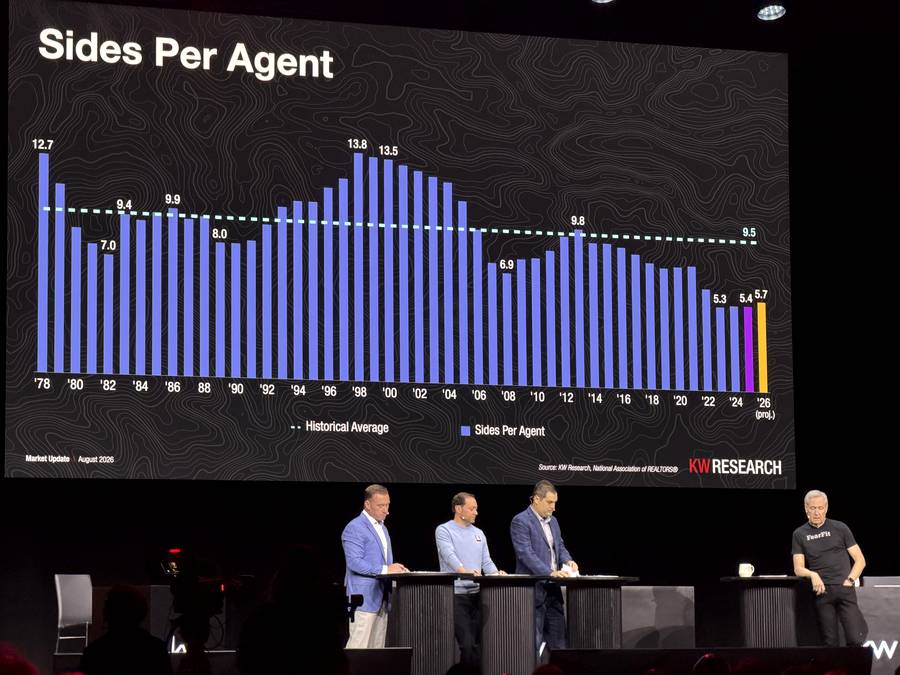
Agents are doing roughly 60% of the historical average in transaction count. And yet:
It’s the second best year ever in the history of real estate in terms of volume. It’s so crazy.
Gary Keller
There is more money in the industry than almost ever. It’s just sitting in the hands of fewer people.
This is the market where there’s no wiggle room. There’s no looky loo buyers or people on the fence. No low hanging fruit.
Gary Keller
This market, like all shifting markets, is the quest for the motivated. That’s the opportunity. You’ve got to find the motivated buyers and sellers.
Jason Abrams
Volume per agent is going the other way
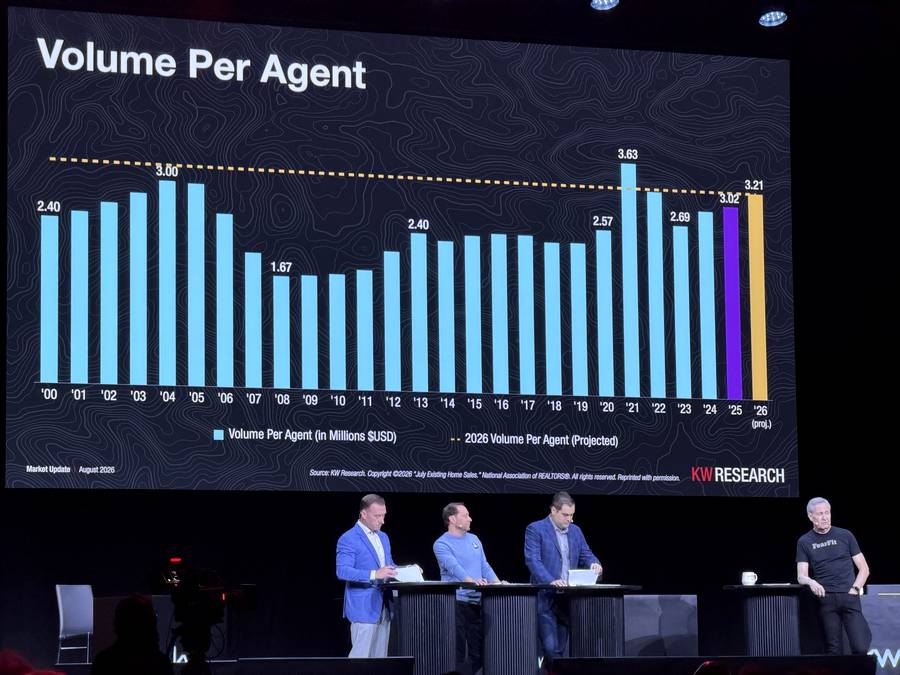
| Year | Volume per agent |
|---|---|
| 2000 | $2.40M |
| 2004 | $3.00M |
| 2008 (trough) | $1.67M |
| 2013 | $2.40M |
| 2019 | $2.57M |
| 2021 (peak) | $3.63M |
| 2023 | $2.69M |
| 2025 | $3.02M |
| 2026 (proj.) | $3.21M |
Volume per agent is rising even while sides per agent sits near historic lows. That is the direct result of higher prices and a shrinking agent count.
And Canada, briefly
Sales down 1.4%, prices up 1%, inventory down slightly. Canada’s central bank is fighting the same inflation problem and Canadian mortgage rates have also risen. A pretty similar story in a lot of ways.
The 21st Century ROAD to Housing Act
The most significant and comprehensive federal housing legislation passed in nearly 36 years, and the first major bipartisan housing bill in decades.
| Theme | Assessment as presented |
|---|---|
| Supply side focus | Primarily a supply side measure with no direct funding for housing. Will not alleviate immediate industry challenges. |
| Regulatory approach | Rather than mandating local zoning changes, it relies on suggestions and incentives to remove development red tape. |
| Institutional buyer impact | Limitations appear largely cosmetic. Carve outs for built to rent and no divestment requirement diminish effectiveness. |
| Long term potential | Immediate relief unlikely, but it may establish a framework for long term shifts in construction methodology. |
Institutional buyers, the restrictions
- Buying ban. Prohibits “Large Institutional Investors” (LII) from purchasing any additional single family homes.
- Definition of a large investor. Any for profit entity, with its affiliates or managers, holding direct or indirect investment control over 350 or more single family homes.
- Definition of single family. Applies strictly to structures with one or two dwelling units intended for residential occupancy.
- Steep penalties. Up to $1 million per violation, or three times the purchase price, whichever is greater.
- 15 year sunset. The prohibition self terminates 15 years after enactment.
Institutional buyers, the loopholes
- No forced divestiture. They are not required to sell any homes owned prior to enactment.
- Build to rent. Investors can still purchase newly constructed homes or purpose built rental communities.
- Renovate to rent. They can buy existing homes that fail local structural or core building codes, provided they spend at least 15% of the purchase price rehabilitating the property.
- Rent to own and cash offer. Companies offering a rent to own or guaranteed sale are exempt. That includes most cash offer companies.
- Corporate transfers. An LII can buy an existing home directly from another LII that owned it prior to enactment.
- Excluded asset types. Manufactured homes, vacant land, and properties with three or more dwelling units.
There were things in that bill that are good. They’re going to help us five or ten years from now versus tomorrow. They’re not going to fix the problems we’ve been talking about for the last thirty minutes.
Ruben Gonzalez
Which is going to keep the new construction numbers down. Because so many of the new construction companies are now building with one client, which is the big guys on Wall Street.
Jason Abrams
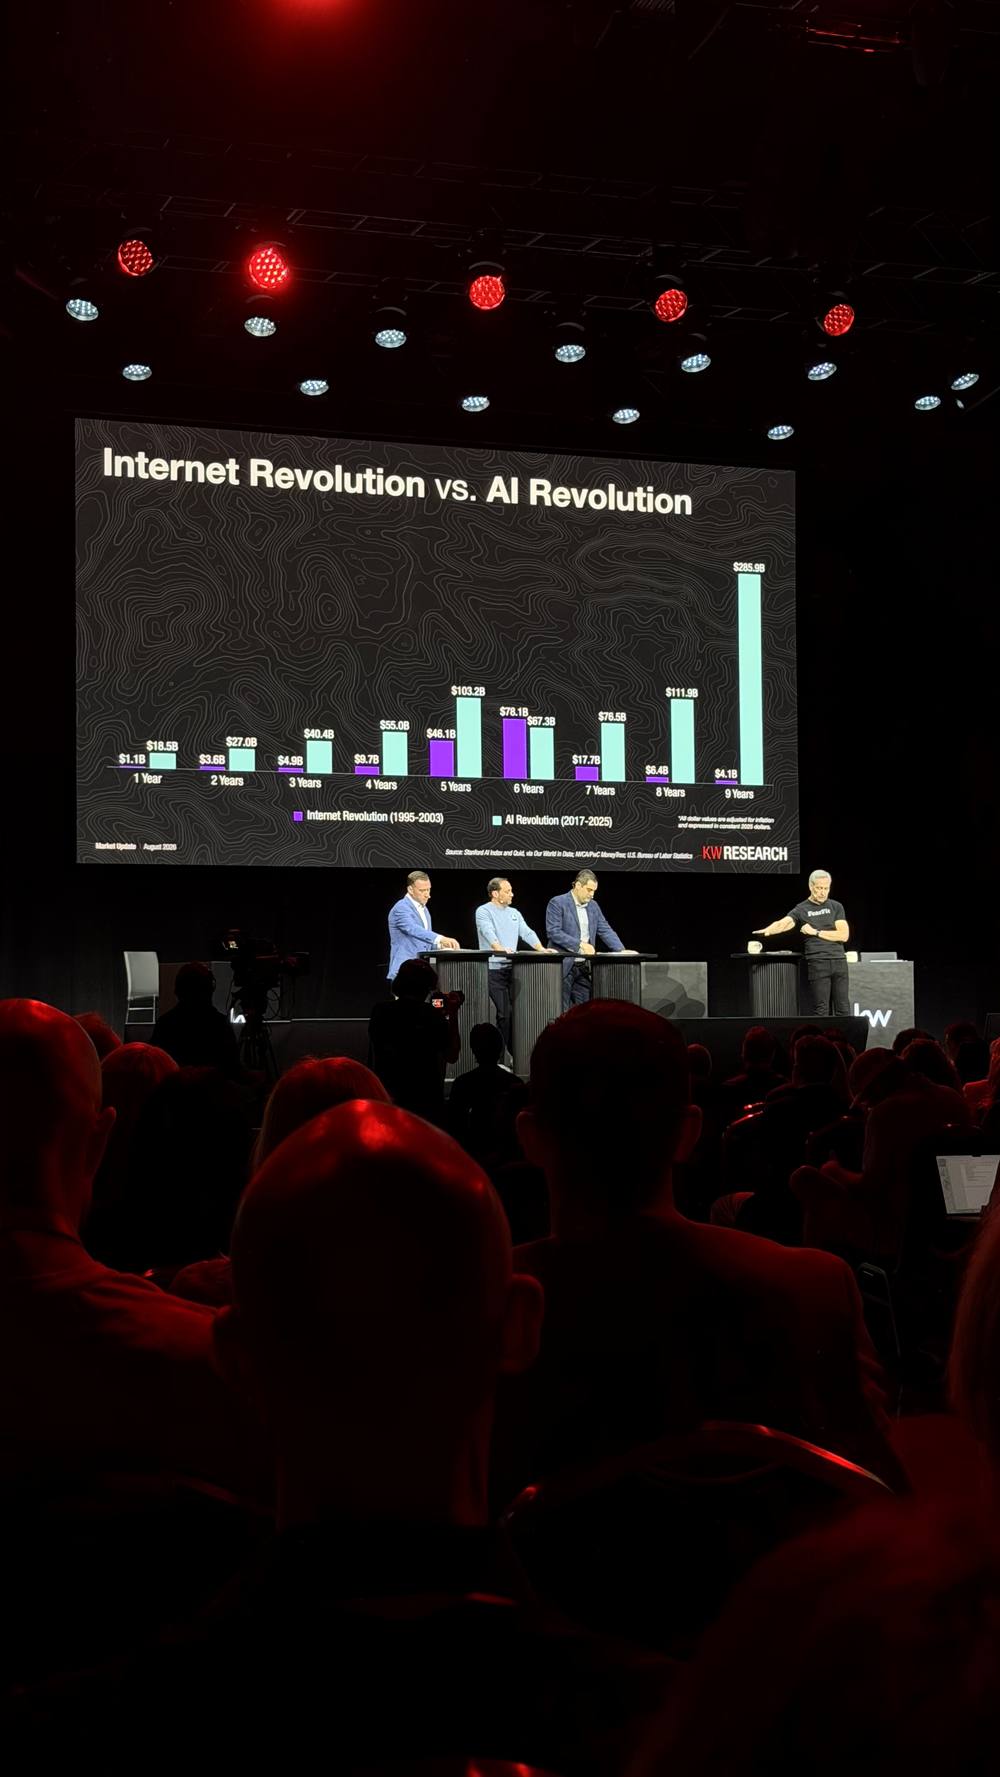
Internet revolution against AI revolution
| Year of revolution | Internet, 1995 to 2003 | AI, 2017 to 2025 |
|---|---|---|
| 1 | $1.1B | $18.5B |
| 2 | $3.6B | $27.0B |
| 3 | $4.9B | $40.4B |
| 4 | $9.7B | $55.0B |
| 5 | $46.1B | $103.2B |
| 6 | $78.1B | $67.3B |
| 7 | $17.7B | $76.5B |
| 8 | $6.4B | $111.9B |
| 9 | $4.1B | $285.9B |
Notice the shape. The internet spiked in year 6 and then collapsed, which is the dot com bust. AI has done nothing but accelerate, ending year 9 at nearly four times the internet’s entire peak year. Gary’s figure: roughly $400 billion poured into AI in the last two years alone. Cody’s: Goldman Sachs projects $1.6 trillion a year by 2031.
There is limited supply, so they’re driving up the prices of everything that goes into making, building AI and making it run. This is very inflationary.
Gary Keller
The debate inside the Fed, and the biggest open question for 2027
| If inflation is | Then the Fed |
|---|---|
| Supply driven, world oil shortages | Can wait and sit on its hands |
| Demand driven, AI capital spending | Has to raise rates to get ahead of it, because it won’t slow on its own |
So will AI replace agents?
I want to be really clear: no one is swiping right to buy a house. That is not happening today, it’s not happening at scale. As a matter of fact, more people than ever choose to work with real estate agents.
Jason Abrams
The argument that we shouldn’t exist is stupid. It’s not based on any sort of evidence of any kind. The consumer doesn’t think that at all. The consumer says the opposite.
Gary Keller
- 4.1% unemployment is a mirage. The rate is low because the labor force is shrinking. About 60K jobs a month against a healthy 200K, and July was negative.
- Job openings and unemployed people have converged around 7.1M to 7.4M. Worker leverage, and wage growth above inflation, is gone.
- Inflation turned back up in 2026. 3.3% projected CPI against 2.7% in 2025. The Fed is in a tightening posture with three members already voting to raise.
- Home sales have been pinned at roughly 4.1M for four straight years, possibly the longest stagnation since at least the 1970s.
- 51.3% more sellers than buyers, and 80% of major metros are buyer’s markets. Roughly one in three non luxury listings takes a price cut.
- New homes now price below existing homes. The governor has inverted, which points to slower existing home appreciation.
- Mortgage rates track the 10 year Treasury, not the Fed. 4.47 plus a 1.94 spread gives 6.49. The 10 year has moved to about 4.7, so rates point up, and the spread widens in rising markets.
- Prices land essentially on the long term 4% trend line next year. About 4% above trend, or roughly $20K on a $500K home. It just doesn’t feel that way.
- Sides per agent at 5.7 sits near historic lows against a 9.5 average, while total industry volume is the second best ever. More money, fewer hands, no low hanging fruit.
- AI capital spending is carrying the economy and it’s inflationary. Whether the Fed reads inflation as AI demand driven or oil supply driven decides what happens to mortgage rates.
Nothing below is a prediction. It is just what the numbers on this page imply if you take them at face value.
Stop waiting for the rate cut to fix your year
Mortgage rates follow the 10 year Treasury, not the Fed, and the 10 year has been moving up. The spread widens in rising markets, so rates can climb faster than the Treasury does. A business plan that depends on 5% money is a plan that depends on something outside anyone’s control.
The pricing conversation changed, so change the script
There are 51.3% more sellers than buyers and 80% of major metros are buyer’s markets. Roughly one in three non luxury listings is taking a price cut. That means the listing appointment is now a pricing appointment, and going in without a documented pricing strategy is how you end up cutting twice instead of once.
Buyers are paying about what they should be, and it feels awful
Prices land essentially on the 4% long term trend line next year. On a $500,000 home the market is roughly $20,000 above where trend says it should be. That is a real number a real person can hold, and it is a lot easier to sit with than “prices are crazy.”
Watch new construction in your market, not just resale
New homes now price below existing homes, which has almost never happened. Builders are sitting on nine months of inventory against a normal six, and they cannot wait the way a locked in homeowner can. In a lot of markets your listing is now competing with a builder who has a quota.
There is more money in the industry, in fewer hands
Sides per agent sit at 5.7 against a historical average of 9.5, while total industry volume is the second best ever recorded. Both things are true at once. The transactions that are happening are being done by people who can genuinely afford to move, and they are going to agents who go find them. There is no low hanging fruit left to pick up by accident.
More from Mega Camp 2026
- Gary Keller’s market update, chart by chartyou are here
- Gary Keller on the four engines of wealth
- Gary Keller interviews Simon Sinek
- Amy Porterfield on social media feeding your database
- Corey Perlman on stopping the sell and starting to serve
Jason Flynn. I run a real estate office in Santa Cruz and write about AI, marketing and the operating side of the business. I go to a lot of these and write up the parts that were worth the trip.
All figures presented by KW Research at Mega Camp 2026 and transcribed from photographs taken during the session. Underlying chart sources as credited on screen: U.S. Bureau of Labor Statistics, U.S. Bureau of Economic Analysis, U.S. Census Bureau, National Association of REALTORS® (“July Existing Home Sales,” ©2026), Freddie Mac, and Robert Shiller. A handful of values read off charts shot at an angle are approximate, and anything Gary said out loud takes precedence over my reading of the chart. If you spot something off, tell me and I will fix it.
Like this? Get the next one.
The AI plays I'm running, a couple times a month. Free.